Physical Address
304 North Cardinal St.
Dorchester Center, MA 02124
Physical Address
304 North Cardinal St.
Dorchester Center, MA 02124


This week saw a significant drop XRP‘s on-chain activity, as evidenced by recent data showing that payment volume, a key measure of the network utility, has fallen by nearly 70%.
XRP transfers between accounts have decreased drastically, according to metrics, from more than 700 million daily transactions at the beginning of October to around 230 million at the end of the month. This sharp drop in transaction flow raises concerns about network demand and the general perception of the Ripple ecosystem.
A decline in payment volume indicates either a short-term slowdown in remittances or institutional activity, or a broader decline in organic usage as the token struggles to regain market share. XRP on-chain metrics have historically experienced long-term declines in tandem with periods of price stagnation, and the current situation appears to be no exception.
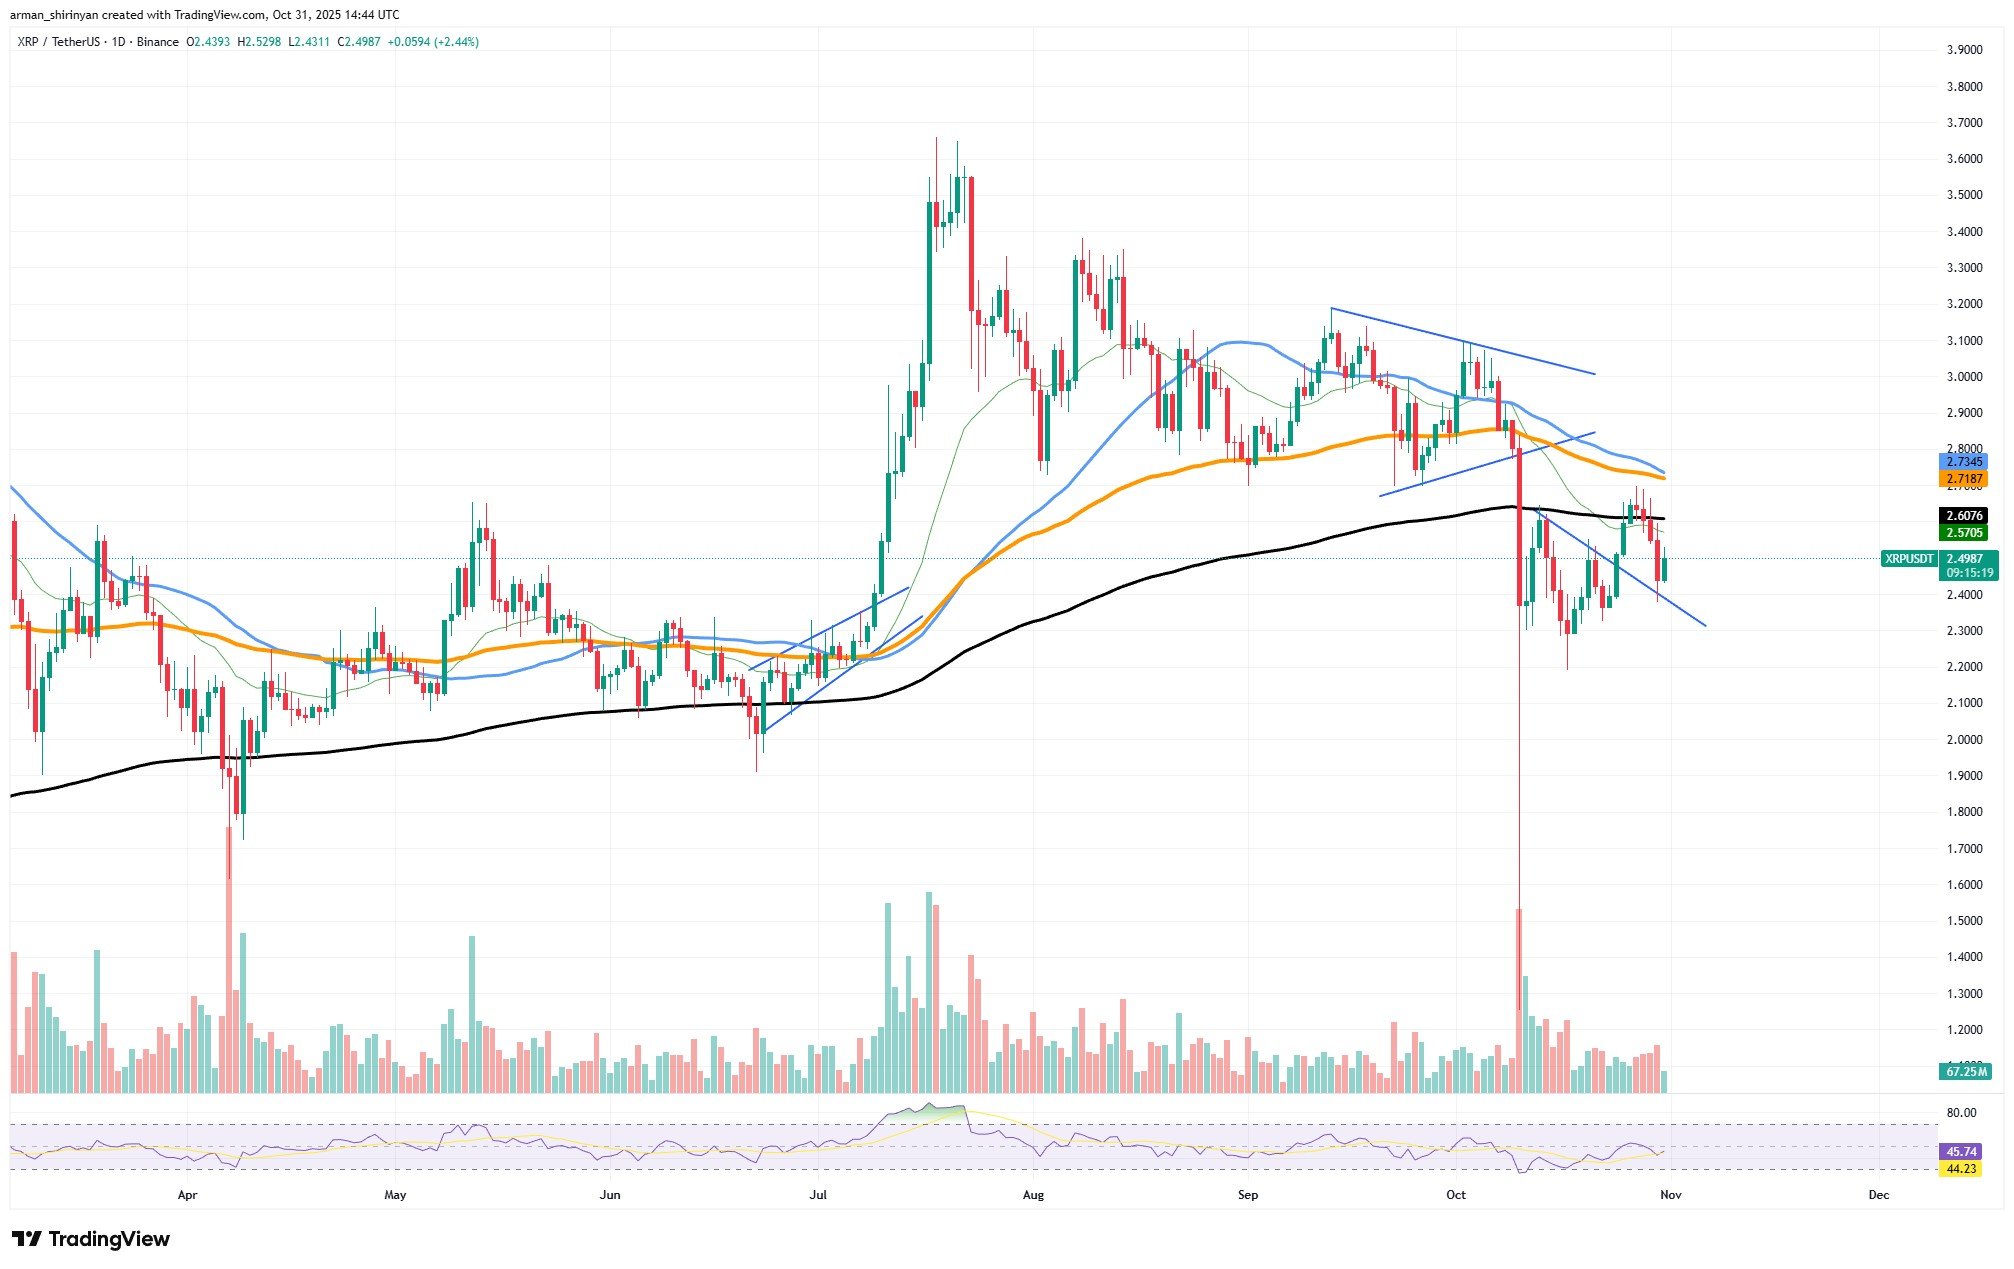
Technically speaking, XRP is currently trading at around $2.49, just above short-term support but still below significant resistance levels indicated by the 100-day and 200-day moving averages, which are around $2.78 and $2.81, respectively. The asset’s recent inability to hold above the trendline after attempting to break out of its bearish wedge suggests bearish sentiment is still present.
Momentum is still weak as indicated by the RSI near 45 which shows a neutral position but is slightly leaning towards bearish territory. A noticeable slowdown in on-chain throughput, along with market skepticism about Ripple’s ongoing regulatory environment, may limit XRP’s growth in the near term.
The $2.40-$2.35 area is still important as short-term support for now; if there is a loss, there may be another correction towards $2.10 or even lower if selling pressure increases. On the other hand, a recapture of $2.80 with a verified breakout would be the first sign of recovery and a resurgence in demand for the network.
As the larger cryptocurrency market stabilizes, Shiba Inu still in trouble and showing no signs of improvement. The token once again fell below important near-term support levels, raising the possibility of further declines.
SHIB is still trapped in the long descending channel that has dominated its price action for months, with its current price hovering around $0.0000099. Despite the short-term recovery, the general trend is still bearish. Continued selling pressure is highlighted by the recent failed attempt to break above $0.0000105, a minor resistance line that is in line with the short-term bullish line.
You might also like it

Even worse is the overall technical picture, which shows SHIB trading well below its 200-day and 100-day moving averages, both of which have served as formidable resistance since September (roughly $0.0000128). Every time the token approached these thresholds, sellers quickly took control and drove the price back down.
At 41, RSI shows no signs of bullish divergence and weak momentum. Additionally, volume has decreased compared to previous spikes, indicating that market players are becoming uninterested and that volatility is easing, which often signals the start of a subsequent decline.
Another logical support is found near $0.0000075 where buyers previously intervened during the previous sell-off if SHIB is unable to hold above this level. The Shiba Inu ecosystem has basically slowed down, and data from the chains suggests that the big holders haven’t accumulated much. There is little chance that the token will change direction anytime soon unless a catalyst or new demand emerges.
Ethereum is currently trading just below the crucial $4,000 level, which is both a technical and psychological barrier that may determine the future direction of the market. After weeks of oscillation, ETH is currently trading at around $3,850, proving its resilience in the face of multiple failed breakout attempts and continued pressure from resistance.
The daily chart surrounded by the 200-day and 100-day moving averages shows a continuous consolidation of Ethereum between $3,600 and $4,200. Over the course of the year, these levels served as both launch pads and denial zones. ETH is currently holding on to support near $3600, which has so far kept a more serious breakout at bay.
You might also like it

However, market caution remains as any drop below this level could reveal ETH to retrace to $3,400. Momentum measures such as the RSI, which is hovering around 44, are neutral but bearish, suggesting that buying power is still low. Volume has also decreased, indicating that traders are unsure and waiting for a signal.
The crucial $4,000-$4,200 range would need to be retaken to signal that the bulls are taking back control, and could pave the way to $4,500-$4,800, especially if Bitcoin holds steady above $110,000. Ethereum’s weakness relative to Bitcoin, which has been a recurring theme throughout October, would confirm another rejection around $4,000.
As money moves into BTC and large-cap altcoins with more momentum, ETH may remain range-bound or gradually decline. Investors should not panic during this time, but should be patient. Although the structure is still in place, Ethereum needs to close above $4,000 with volume to return to the bullish outlook. Until then, ETH is balancing between holding support and entering the next corrective phase, making a breakout of $4,000 crucial.