Physical Address
304 North Cardinal St.
Dorchester Center, MA 02124
Physical Address
304 North Cardinal St.
Dorchester Center, MA 02124


Per SightX
If you work in market research and insights, you’ve probably come across the terms “significantly different,” “confidence level,” or “margin of error” used to describe and compare data sets.
And with good reason!
Significance testing is one of the most commonly used tools by research and insight professionals to better understand whether the differences they see between segments (groups of data) are statistically significant or just noise in the data.
Today we’re going to explore the ins and outs of significance testing and give you some ways to make it easier to use in your own research!
Subscribe to receive Research Tool Radar and essential updates via email from Insight Platforms.
In market research, statistical significance is used when comparing sets of data. It’s a measure that allows you to understand whether those differences you’re seeing are truly “significant” or caused by random sampling error.
There will always be variations in your data. Even if you run identical studies a few hours apart – chances are your results won’t look the same exactly same.
Significance testing allows you to understand whether these variations are noticeable or just a fluke.
For example, let’s say you’re running a concept test for your upcoming ad campaign. After you expose respondents to your ads, you ask them how likely they are to buy your product. But when the data is collected, these are your results: 64% of respondents were likely to buy your product after seeing the first ad, while 72% said the same after seeing the second ad.
So you’re wondering if that 8% difference is meaningful?
This is exactly where significance testing comes into play.
The term “statistically significant” is often misunderstood, causing it to be applied to things that may not actually be statistically significant (like an entire survey, for example).
If a data set has “low significance,” it doesn’t necessarily mean that what you tested is bad for your product or brand.
To fully understand any of the significance tests you perform, you will need to be able to read the results, also known as p-values.
These are values between 0 and 1 that tell you whether the results are statistically significant or random. The closer the value is to 0, the greater its significance.
So a p-value of 0.01 means that there is only a 1% chance that the differences you see are due to random error. Or simply put, you can be 99% sure that the results reflect significant differences.
We all know that nothing in life is 100% certain. But since our insights are crucially driving branding, products and marketing strategies, we need to be as close to 100% certain as possible.
When you calculate statistical significance, you do so at a certain confidence level.
That level of confidence shows you how confident you can be that the results are truly meaningful. So if you choose a 95% confidence level, that means you can know with 95% certainty that your results are statistically significant.
We always suggest that you use the industry standard of 95% as the default confidence level. However, you can change your trust level when needed SightX platform.
There are many types of significance tests you can run depending on the results you want, the data you have, and what exactly you are comparing. All this to say – things can get confusing quickly, even for those familiar with the subject.
So to keep things simple, we will discuss the main types of significance testing we use on SightX platform, which helps you better understand what’s going on behind the scenes.
Researchers use Analysis of Variance (ANOVA) when investigating whether there is a significant difference between three or more groups of data. You can use ANOVA to understand whether age, gender, and region are related to how much someone spends on your products. But it’s important to note – this test will only tell you if there is a significant difference within the data set or not.
On the other hand, Chi-square is used to test the difference between two categorical variables. You can use the Chi-square test to find out whether income level and preference for a particular brand are related. But similar to ANOVA, Chi-Square tests will only tell you IF there is a significant difference.
If your ANOVA or Chi-Square test indicates that there is a significant difference, then you need to find out where it is in your data. Use of a Post-hoc test, you can quickly see which data sets have significant differences.
If all this sounds a bit overwhelming – you are not alone! And that’s exactly why we automated the entire process.
Although we love manual math as much as the next insights professionals, we’ve simplified the process significantly (😉).
With our automated significance testing, you can quickly assess whether differences in your consumer data are significant or could have occurred by chance. In the analysis dashboard, open the toolbox and select the yellow Significance Testing icon, select the confidence level and click “apply”.
.gif)
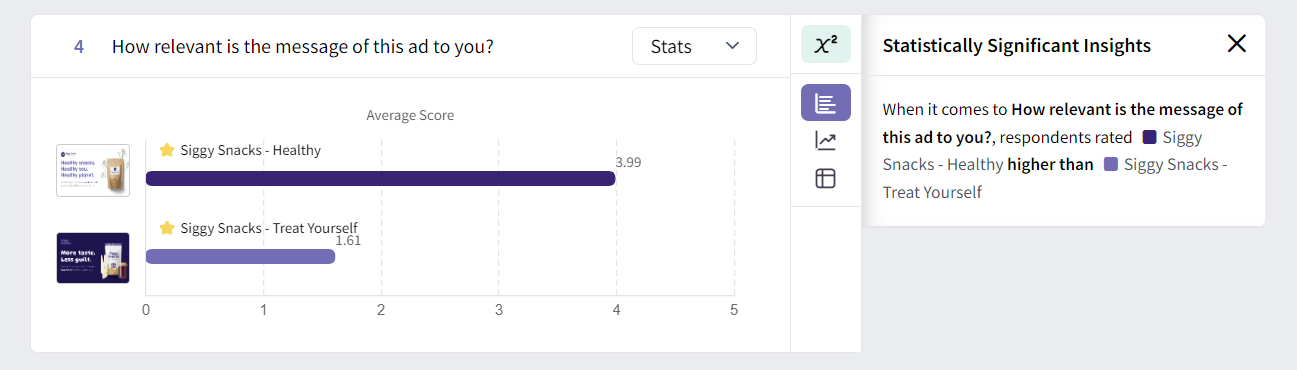
All visualizations will automatically update with the appropriate significance test data. Options with statistically significant data will appear with an asterisk, and significant insights are shown to the right.
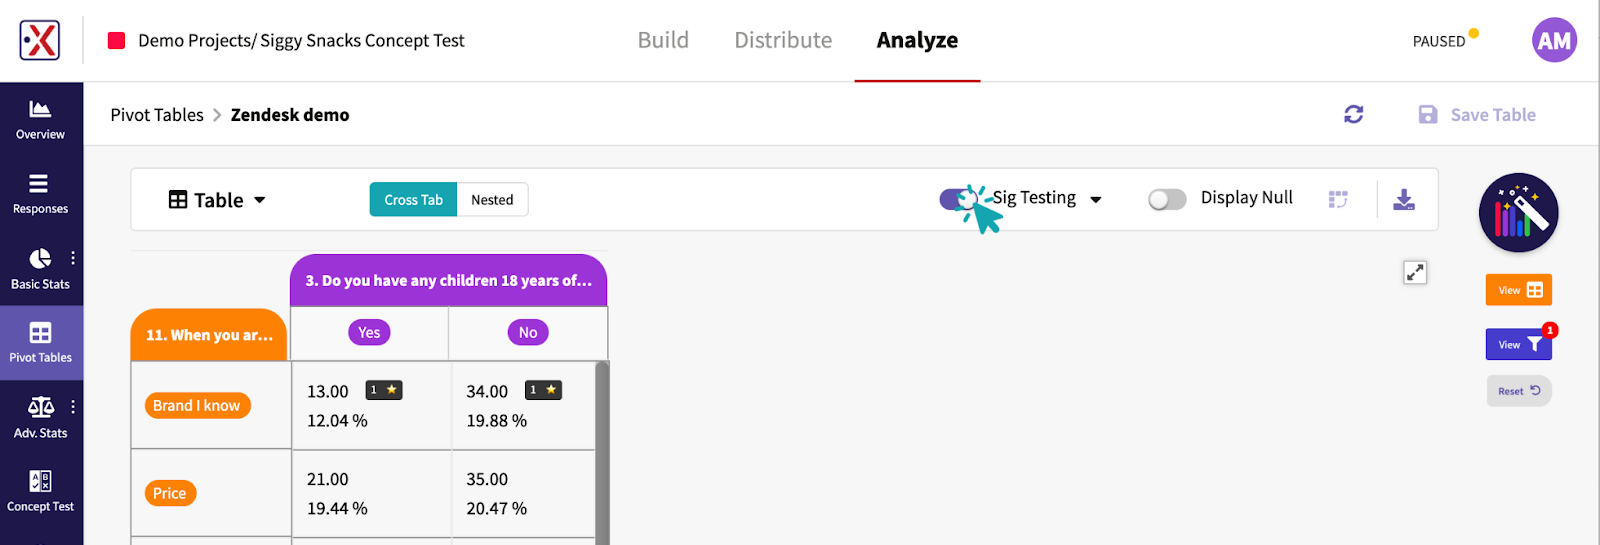
And for your crosstabs and pivot tables, automated significance testing is just as easy. Once you’ve generated your table, simply toggle the “Sig Testing” option at the top of the page to instantly see which of your data points are statistically significant.
Additionally, if you’re looking for more detail, you can hover over a cell with a significance indicator (⭐) to see the p-values and which cells are significantly different from the cell you’re hovering over.
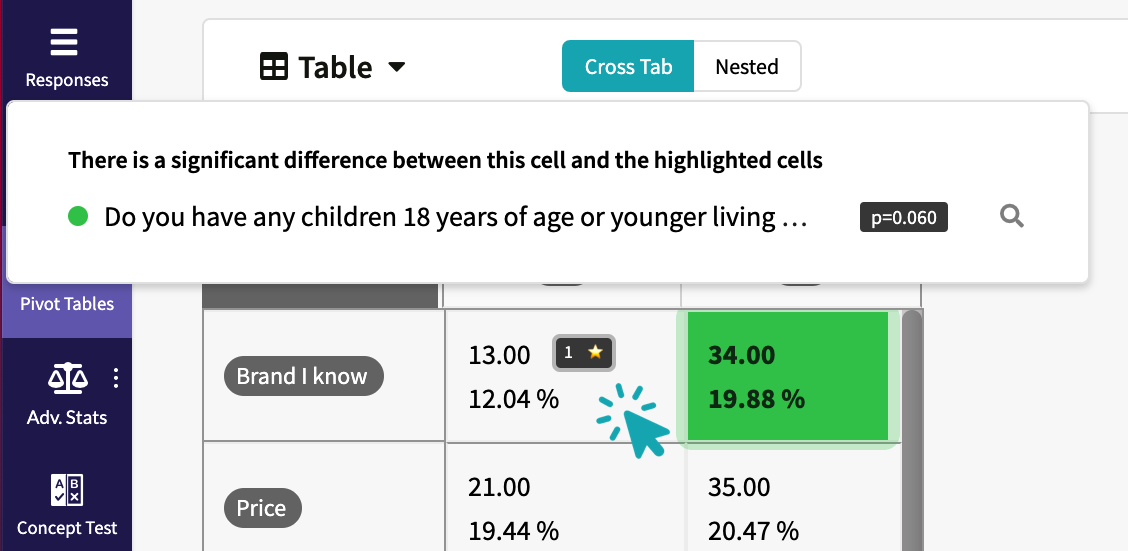
As you can see in the example above, our p-value is 0.060. This means that we can be 94% sure that our data is statistically significant, and there is only a 6% chance that the difference is due to chance.
If you’re ready to improve your insights, we have the tools to make it happen!
The SightX platform is the next generation of market research tools: one unified solution for consumer engagement, understanding, advanced analysis and reporting.